

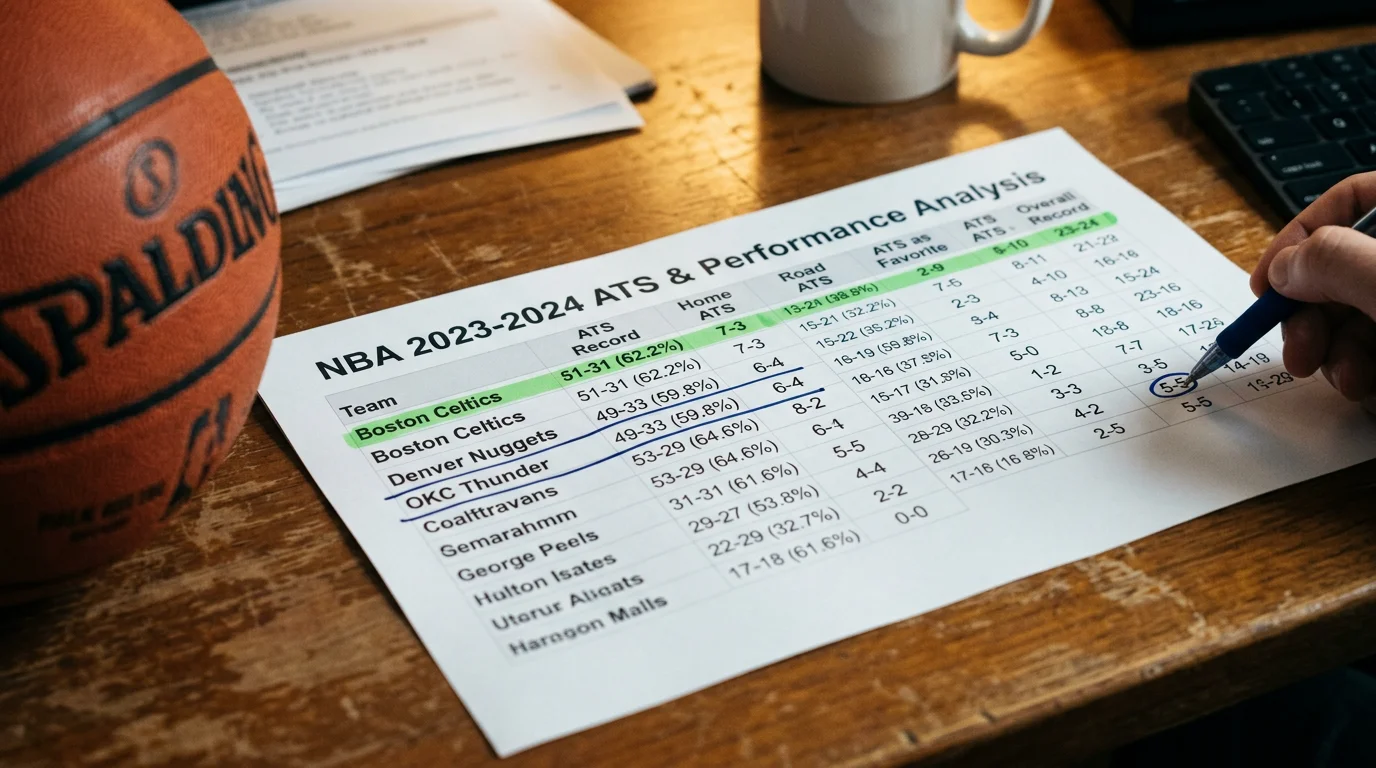
When I first encountered ATS records, I treated them like magic numbers. The Lakers were 8-2 ATS over their last ten games – obviously I should bet on them covering. It took an embarrassing number of losses before I understood that ATS records describe what happened, not what will happen. Learning to interpret this data correctly transformed how I use historical performance in my betting process.
ATS records – against the spread records – track how often a team beats the point spread rather than simply winning games. A team might be 30-25 straight up (wins and losses) but 28-27 ATS (covering the spread 28 times while failing to cover 27 times). For spread bettors, ATS records matter more than win-loss records because they measure performance against the betting line, not just against opponents.
Understanding what ATS data can and cannot tell you is essential. These records provide genuine information about betting outcomes, but naive interpretation leads to systematic errors. The data requires context, filtering, and appropriate scepticism before it becomes actionable intelligence.
What ATS Records Actually Measure
ATS records measure whether a team exceeded market expectations, not whether they played well. This distinction is crucial and often misunderstood.
A team that covers the spread outperformed their predicted margin. They might have won by more than expected, or lost by less than expected, or won when expected to lose. The common element is exceeding the line, not exceeding some absolute standard of quality.
Strong ATS records indicate that the market consistently undervalued a team relative to their actual performance. Weak ATS records indicate consistent overvaluation. Neither directly measures team quality – a bad team can have excellent ATS records if the market prices them too pessimistically, while a great team can have poor ATS records if the market prices them too optimistically.
The market adjusts. This is the most important concept for interpreting ATS data. If a team has covered ten consecutive spreads, the market will adjust future lines to reflect this pattern. The eleventh spread will already incorporate the information that previous spreads contained. Blindly betting teams with hot ATS streaks often means betting into adjusted lines that offer no remaining value.
Sample size matters enormously. A 5-0 ATS record over five games tells you almost nothing – variance can easily produce such runs. A 55-45 ATS record over one hundred games provides meaningful signal about systematic mispricing. I generally want at least thirty games before drawing conclusions from ATS data.
Where to Find Reliable ATS Data
ATS data is widely available, but quality varies across sources. Using unreliable data produces unreliable analysis.
Free resources provide basic ATS information for most bettors’ needs. Team season records, recent game records, and situational splits (home/away, favourite/underdog) are available on numerous sports statistics websites. These cover fundamental ATS tracking without cost.
Premium services offer more granular data and sophisticated filtering. Historical ATS records across multiple seasons, specific situational breakdowns (back-to-back games, rest advantages, divisional matchups), and automated alerts on ATS trends cost money but provide deeper analytical capability. Whether the cost is justified depends on your betting volume and approach.
Different sources may show slightly different ATS records because they use different bookmakers’ lines for calculation. A team that covered at one book might not have covered at another if the lines differed by a point. This discrepancy rarely affects conclusions from large samples but can cause confusion when comparing specific game records across sources.
I maintain my own tracking spreadsheet alongside external sources. Recording the lines I actually bet, the results, and the margins helps verify external data and creates a personalised database tailored to my specific betting activity. This effort is worthwhile for serious bettors who want maximum accuracy.
How Far Back to Look at ATS Data
The relevance of historical ATS data decays over time. Last week’s results matter more than last year’s results, and last year’s results matter more than results from three years ago.
Within a single season, ATS records from the past twenty to thirty games provide useful signal. This window is large enough to reduce variance noise but recent enough to reflect current team construction and form. Early-season games matter less as rosters gel and teams find their identity.
Cross-season ATS data becomes complicated. Rosters change through trades, free agency, and draft selections. Coaches change, bringing different systems and strategies. A team with strong ATS history might have completely different personnel than the team that generated those records. I weight current-season data heavily and use prior seasons primarily for pattern identification rather than direct prediction.
Situational ATS records require larger windows because the situations occur less frequently. A team’s back-to-back ATS record might include only ten games in a single season – not enough to draw conclusions. Looking back two or three seasons for situational patterns makes sense, accepting that roster changes add noise to the signal.
Coaching continuity affects data relevance. A team with the same coach for five years carries more meaningful historical data than a team with a new coach. The offensive and defensive systems remain consistent, making past performance more predictive. First-year coaches essentially reset the historical relevance clock for their teams.
Using ATS Records Wisely
ATS records should inform your analysis, not determine it. They are one input among many rather than a standalone betting system.
Look for persistent patterns rather than recent streaks. A team that has been undervalued by the market for multiple seasons might represent systematic mispricing worth exploiting. A team on a ten-game ATS hot streak might simply be experiencing normal variance that will regress.
Combine ATS data with explanatory analysis. If a team has strong ATS records, ask why. Do they have undervalued depth that shows up against point spreads? Do they perform well in close games? Is their star player systematically underrated? Understanding the cause of ATS success helps predict whether it will continue.
Be especially sceptical of extreme ATS records. A team at 15-2 ATS over seventeen games is likely experiencing variance that will not persist. The market is not consistently wrong by enough margin to produce such records through skill alone. Expecting regression to mean ATS performance is usually correct.
Use ATS data to identify potential opportunities, then do deeper analysis. If a team has quietly compiled strong ATS records without receiving attention, investigate whether genuine mispricing exists. The ATS record is the flag that draws attention; the underlying analysis determines whether to bet.
For understanding how the spread mechanics that ATS records measure actually function, the point spread betting guide explains the fundamentals that make ATS analysis meaningful.
Articles
Written by the editors at pointbetbasketball.com.
